In this lesson, we talk about the browser Dev Tools and explain how to use them to your best advantage. Learn how the network inspector and client tools can ease your work as a developer.
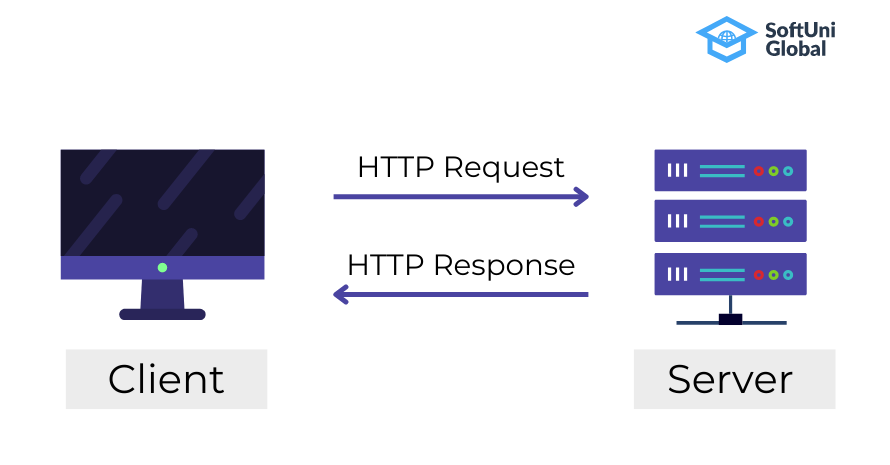
The HTTP flow of requests and responses can give you useful information about how the web application communicates with the server. It can improve your software development process, and save you time and effort when debugging.
Built-in Browser Tools
Modern Web browsers have a set of built-in tools for monitoring the HTTP traffic. The functionality of these tools includes also inspecting the already rendered HTML elements and debugging right into the browser.
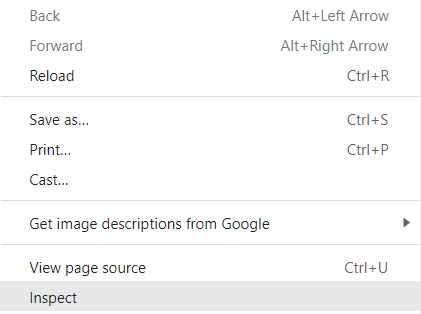
Chrome Developer Tools can be accessed by pressing the [F12] key in Google Chrome. Another way is to right-click anywhere on the Web page and select [Inspect] in the context menu.
This opens a panel with several tabs. The Elements tab shows the HTML used to build the current Web page. It holds information about the UI controls in the Document Object Model (DOM) tree.
The Console tab shows errors and logs for the currently loaded Web Page. The tab is also used for executing JavaScript commands and interacting with the page.
You can set breakpoints and evaluateexpressions in JavaScript through the Sources tab. All files that were used to make the website are listed here.
To monitor the data exchanged between the current page and the Web server, we use the Network tab. This tab is commonly used to confirm that resources are downloaded or uploaded correctly.
When you click on a link, the browser sends multiple requests to the server regarding different elements of the page. The HTML required to render the page is sent back in the form of responses from the server. There is information about every response that includes HTTP request URL, the request method, remote server IP address and port, status code and many other technical details.
Client Tools
Another useful tool for developers who need information on HTTP traffic is the Postman HTTP client. This tool is used for composing and sending requests, analyzing HTTP responses from the server for testing, debugging server APIs and for resolving technical issues during the software development process.
With Postman you can create an HTTP request, send it to the Web server, view the HTTP response, and generate a source code to execute the HTTP request in many languages, such as JavaScript, C#,Java, Python, PHP and many others.
Another alternative for an HTTP client tool is the Insomnia Core Rest Client. In case you prefer a Web-based HTTP tool, you can try Hoppscotch.